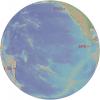
Bathymetry
GMRT World Map (2009)
Fri, 05/22/2009 - 15:28 — mgds
The Global Multi-Resolution Topography (GMRT) synthesis is a continuously-updated compilation of seafloor topography including multibeam bathymetry data from throughout the global and coastal oceans (view contributors). It is maintained as a multi-resolution gridded digital elevation model of seafloor bathymetry to ~100 m spatial resolution.
Kane Fracture Zone - 3D View (2008)
Fri, 07/11/2008 - 17:43 — mgds
The viewer is looking in a west-north-westerly direction along the transform fault in the Kane fracture zone, where the Africa Plate (upper right) and the North Atlantic Plate (left) are formed. This fracture zone is located in the central Atlantic ocean, on the slow-spreading Mid-Atlantic ridge between Africa and the Caribbean Sea. Shipboard multibeam bathymetry provides this closeup 3D view of the ocean floor; the checkerboard effect seen in part of the image is an artifact of the pattern made by the ships' tracks.
Species (common):
Year: 2008
Details: Mid-Ocean Ridge
Media Type: Map
Hawaii 3D (2008)
Thu, 07/10/2008 - 15:31 — mgds
This three-dimensional view of the entire chain of islands that form the Hawaiian archipelago show how the islands rise individually from the deep sea. The Hawaiian Islands were formed by volcanoes that formed as the Pacific plate moved over a hotspot in the mantle.
Species (common):
Year: 2008
Details: Hawaii
Media Type: Map
Data Type: Bathymetry
Device Type: Sonar:Multibeam
Feature:
Investigator: MGDS
Expedition:
Chief Scientist:
Species:
Visualization of the East Pacific Rise (2012)
Mon, 01/16/2012 - 11:34 — mgds
Compiled visualization of datasets from the East Pacific Rise (EPR) Integrated Study Site (ISS). At right, ship-based EM300 bathymetry (25-m resolution) shows the axial high between 9°46'N and 9°56'N [White et al., 2006]. A higher resolution bathymetry data set (5-m resolution) collected in 2001 by the autonomous underwater vehicle (AUV) ABE is overlain and shows greater details of the volcanic terrain [Fornari et al., 2004; Escartin et al., 2007].
Bathymetry of EPR with vent locations (2012)
Mon, 01/16/2012 - 11:30 — mgds
Bathymetric map of the East Pacific Rise focused study area near 9°50'N showing the locations of high and low-temperature vents prior to and after the 2005-2006 eruptions. Vent locations active before the 2005-2006 eruptions are labeled on right. All except those labeled in blue continued to be active after the 2005-2006 eruptions. New vent sites that became active after the latest eruptions and were sites of experiment deployments and sampling are labeled on left (e.g., Mkr #s).
East Pacific Rise Integrated Study Site (2012)
Mon, 01/16/2012 - 11:27 — mgds
(left) Bathymetry of the East Pacific Rise (EPR) based on data compilation and archiving enabled by the Ridge 2000 Data Portal at the Marine Geoscience Data System (MGDS) (http://www.marine-geo.org/index.php) [Carbotte et al., 2004; Ryan et al., 2009]. (right) Perspective image of multibeam bathymetry for the EPR 2nd order segment between Clipperton and Siqueiros transforms. EPR ISS focused study area near 9°50’N shown by red dot. Black line shows the location of the axial summit trough [Soule et al., 2009] where most of the hydrothermal vents and biological communities are located.
Mid-Atlantic Ridge Bathymetry at 13N (2012)
Thu, 01/12/2012 - 16:45 — mgds
a) Bathymetry from the 13 N region of the Mid-Atlantic Ridge. Gray shading indicates two core complexes that have formed in the middle of a spreading segment. The box is the region interpreted in (b). Black lines: borders of the MAR ridge axis, the tops of rotated faults, and schematic striations on core complexes. B: basins that have formed during the outward rotation of the tops of the faults. b) Line drawing of the bathymetry in the box in (a) showing striated core complexes and the tops of rotated faults. B: basins as in (a).
Ridge 2000 Integrated Study Sites (2012)
Tue, 01/10/2012 - 18:27 — mgds
Locations of the three Ridge 2000 Integrated Study Sites plotted on the Global Muti-Resolution Topography (GMRT) synthesis (Ryan et al., 2009) using Virtual Ocean. EPR= East Pacific Rise 9N, END=Endeavour Segment of the Juan de Fuca Ridge, LAU= Eastern Lau Spreading Center.
Species (common):
Year: 2012
Details:
Media Type: Map
Data Type: Bathymetry
Device Type:
Feature:
Investigator: Vicki Ferrini
Expedition:
Chief Scientist:
Species:
Perspective view of bathymetry at Vema Transform (2003)
Mon, 08/31/2009 - 15:31 — mgds
The Vema transform region viewed from the northeast. Figure is based on multibeam data obtained during cruises EW9305, and S-19 and S-22 (RV Akademik N. Strakhov). The Vema lithospheric section (VLS) is clearly visible. Location of magnetic chrons C5 and C6, of the Nautile submersible profiles, and of the rocks sampled along the VLS, are indicated. The inset shows a satellite-derived gravity image of the Central Atlantic, where the Vema fracture zone (FZ), the transverse ridge and the long-lived EMARS can be identified.
Species (common):
Year: 2003
Details:
Media Type: Map
Perspective view of EPR AST (2001)
Wed, 04/15/2009 - 20:44 — mgds
Perspective view of the eruptive fissure along the axis of the East Pacific Rise from 9°49N to 9°51N looking to the north. This region is the site of documented volcanic eruptions in 1991-92 and 2006. Image is created from very high resolution bathymetry data gridded at 5 meter grid interval collected with the Autonomous Underwater Vehicle ABE. Data from Fornari et al., AGU Monograph 148, 2004. Image made using GeoMapApp.
Species (common):
Year: 2001
Details:
Media Type: Map
Data Type: Bathymetry
Device Type: Sonar
Feature: EPR:9N:9_50

